Bringing the DataEngBytes experience into the GenAI era

I founded Cloud Shuttle in 2020, but people in my network often know me as ‘the conference guy’. I founded the Data Engineering meetup in Sydney back in 2017, a meetup group that has now expanded to Melbourne, Brisbane, Perth, Hobart and Auckland (check it out!). From the community established from the data engineering meetup groups, I then launched DataEngBytes, a community event which has grown to become multi-city, full-day conferences with well over 1,000 attendees each year. In 2024, we’re even expanding into New Zealand for the first time.
Wanting to provide an even better experience for our community, our organisers started to create and add richer features, including our revamped website. Putting on my data and AI cap, I started to toy with the idea of a chatbot that would be useful for our attendees and prospective attendees.
The challenge
We settled on building a chatbot that our community could ask their most burning questions relating to DataEngBytes. For example:
- When will the conference be and where?
- Which companies attended last year?
- Which companies similar to mine attended last year?
- (most importantly, of course :-D ) Will there be catering, coffee, swag or prizes?
The problem: LLMs are about language prediction, and their output is based on what they know up until a certain period of time. The corpus that they are trained on is the limit of their knowledge. Meaning – they wouldn’t know anything about DataEngBytes. Not one iota.
For an LLM to be useful for our purposes, Retrieval-Augmented Generation (RAG) is needed to augment what an LLM knows with the event/organisation-specific DataEngBytes information.
What’s RAG? Let me give you a primer.
Retrieval-Augmented Generation (RAG)
Retrieval-Augmented Generation, or RAG for short, is a technique that makes LLMs more reliable by having them check against external information from authoritative sources before they generate a response. There are two main types of RAG, a vector store and a knowledge graph.
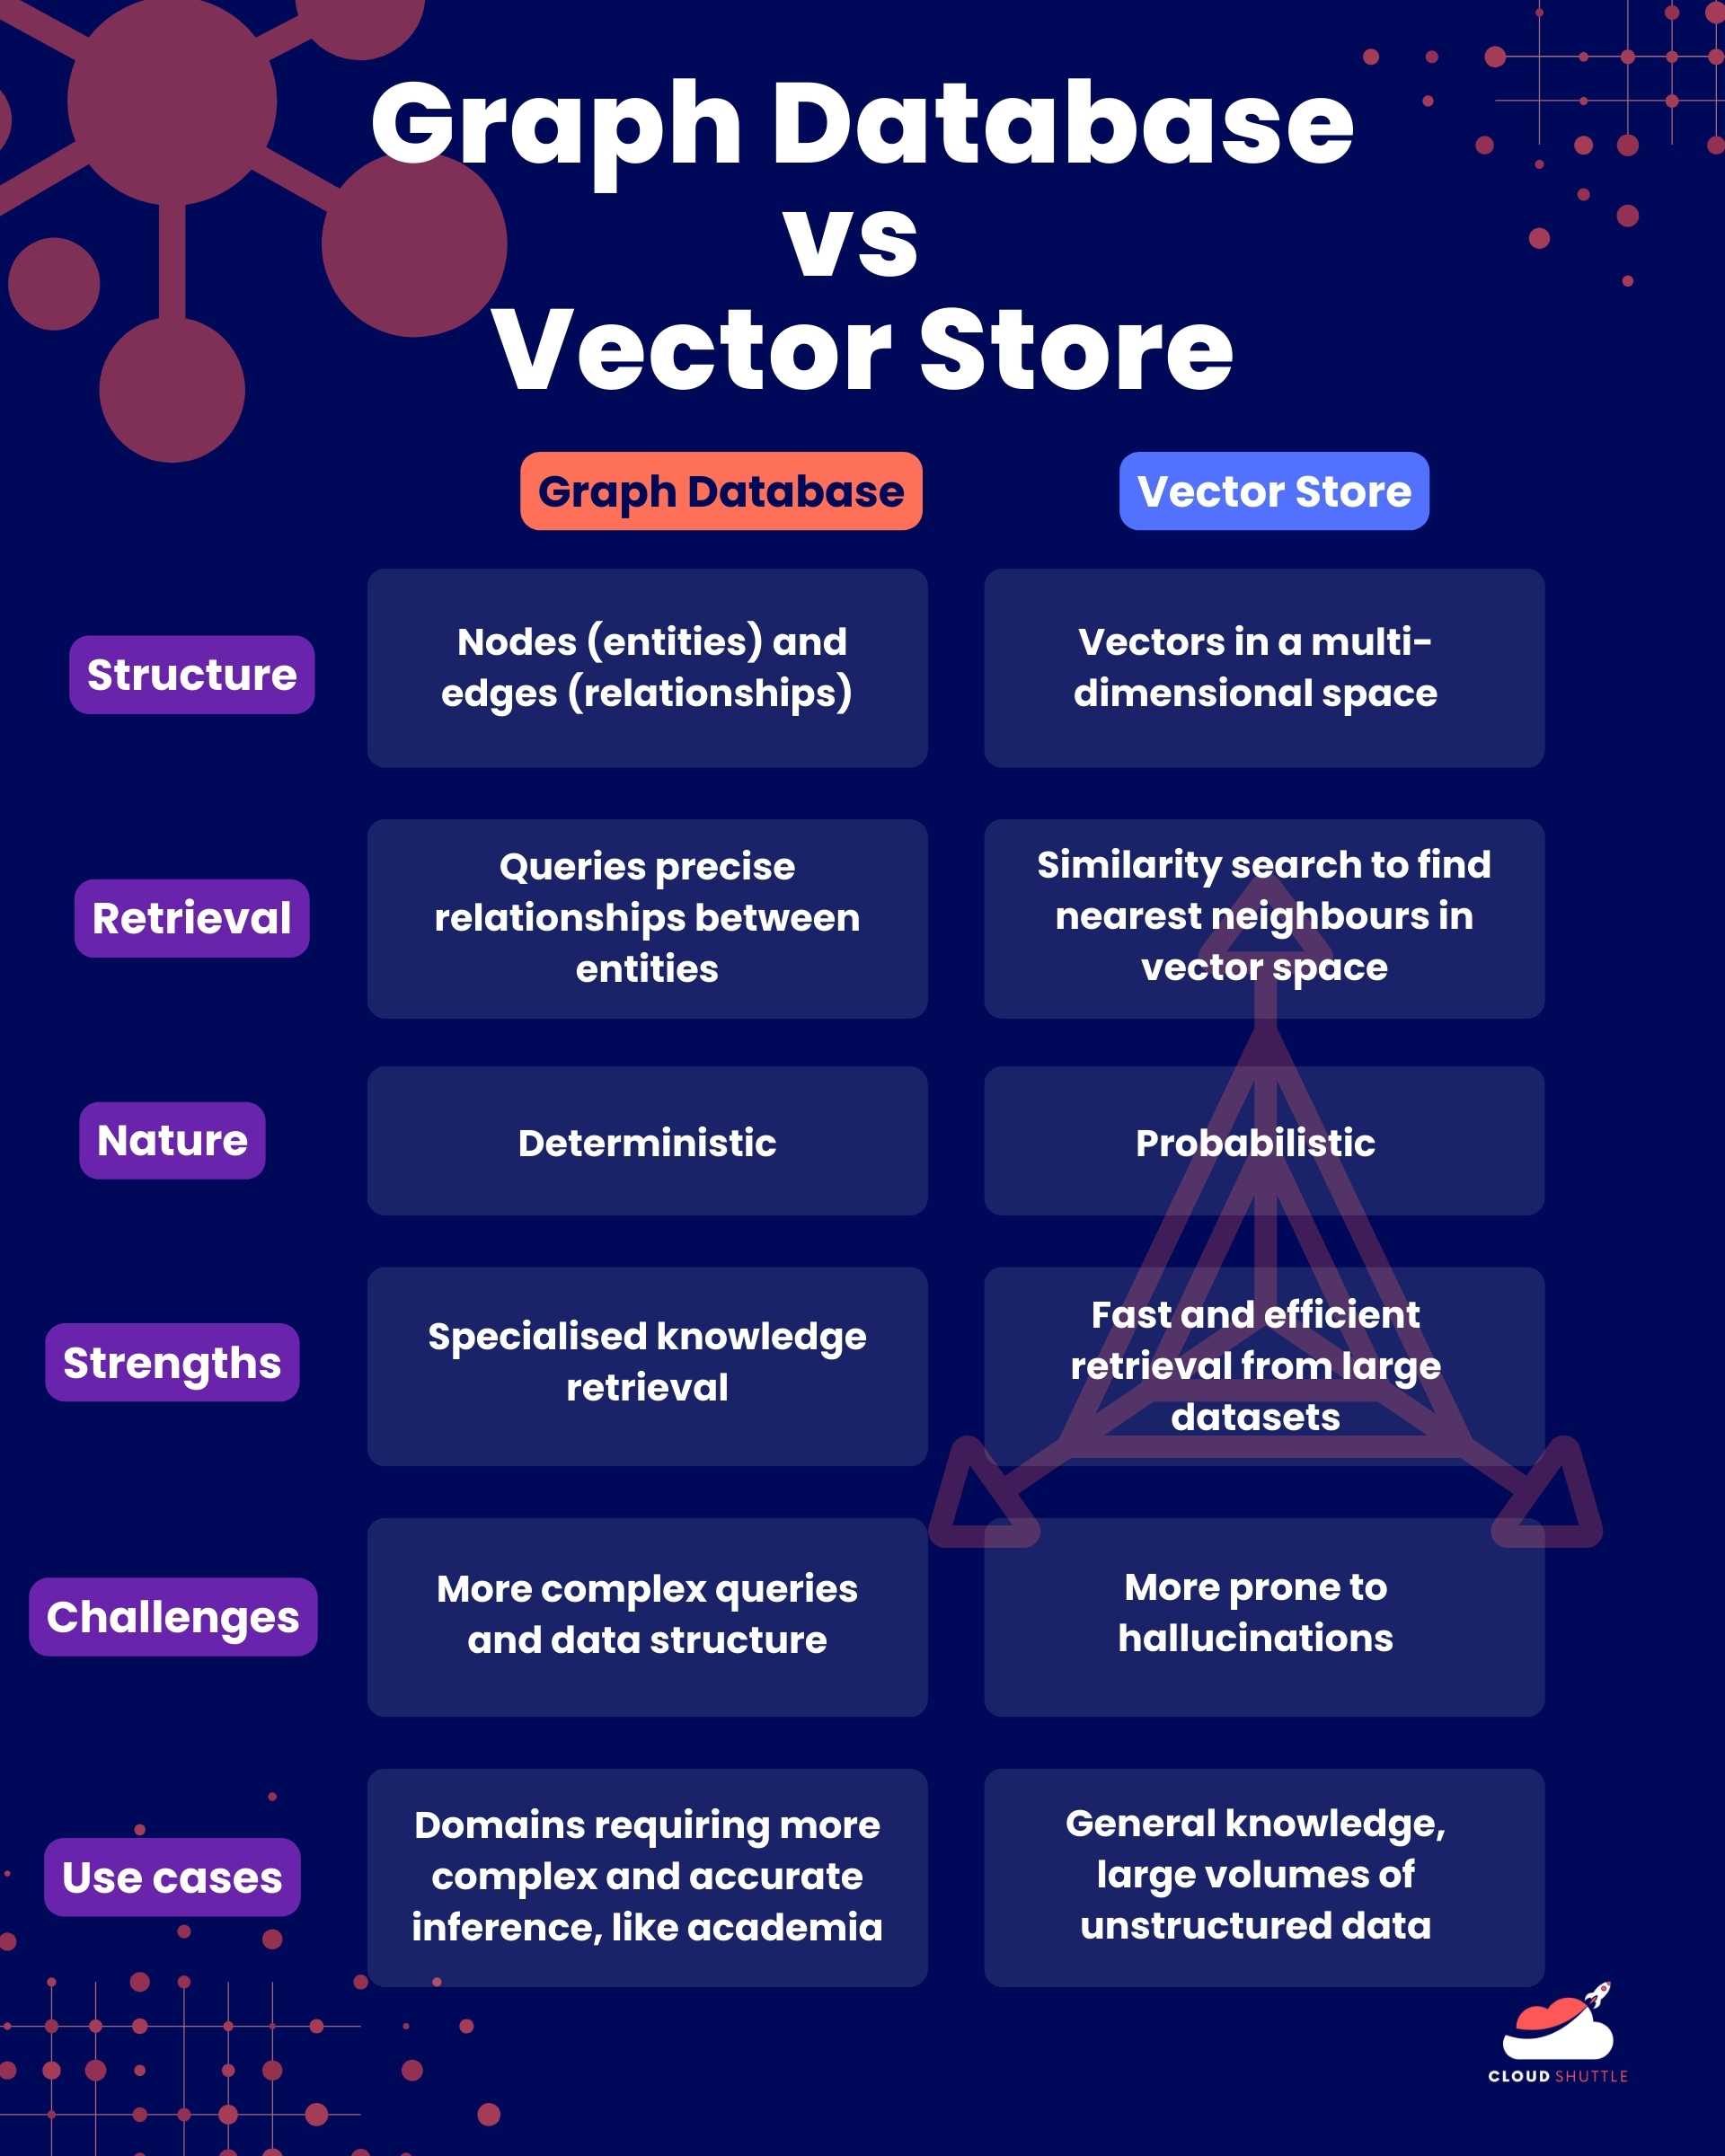
Vector stores
As its name implies, vector databases store data as vectors of numbers. Vector stores really shine when it comes to handling large volumes of unstructured data. They operate by converting things like text, audio or images to vectors (multi-dimensional space). They enable very fast and efficient retrieval from large data sets. Embeddings, which are used in virtually all well-known NLP models, are vectors of numbers that encode the meaning of words in a way that captures their semantic relationships with other words. What this means is that when the LLM searches against these vectors, they look for nearest neighbours. Vector stores are probabilistic in nature.
Knowledge graphs
Knowledge graphs, on the other hand, represent knowledge in a structured format using nodes (entities) and edges (relationships between entities). This structure means data that is relational and hierarchical can be retrieved very efficiently. Because of the explicit relationship of the edges and nodes, it is more deterministic in nature. While vector databases can only tell you how similar or related two entities are, knowledge graphs can actually tell you how the entities are related. For example, it can tell you if an entity is a subset of another, and the exact relationships between different entities. Knowledge graphs can be a highly effective way of knocking out hallucinations in LLMs.
This means that knowledge graphs are better than vector databases for applications that require very deep and specialised knowledge, or where more complex inference and reasoning is required, for example in the academic, engineering and medical fields.
Combining vector stores and knowledge graphs
Depending on your use case, each type can be a powerful solution on its own. They can even be combined for the best of both worlds when you need to leverage structured relational data as well as similarity-based retrieval. For example, combining both can lead to enhanced search capabilities when you use knowledge graphs to understand the context and relationship behind a query, and a vector database to retrieve items contextually similar to the query vector.
DataEngBytes Chatbot
<div style="position: relative; width: 100%; padding-bottom: 56.25%"><iframe src="https://youtu.be/wk65-K0oJhw?si=bVd12ErekEUf_Z4T" title="Bringing DataEngBytes into the GenAI era" frameborder="0" allowfullscreen allow="accelerometer; autoplay; clipboard-write; encrypted-media; gyroscope; picture-in-picture" style="position: absolute; width: 100%; height: 100%;"></iframe></div>
We built out our POC for the DataEngBytes chatbot, hosting an app on LangChain serve, Neo4j Knowledge Graph and Amazon Bedrock for the LLM.
While vector stores are formidable in their own right and getting more powerful day-by-day, we used a knowledge graph-based approach for our chatbot, because the specificity of the DataEngBytes information requires a more deterministic model.
Let’s imagine that attendees or prospective DataEngBytes attendees might want to ask the following questions:
- When is DataEngBytes in Sydney?
- What companies attended DataEngBytes in Sydney last year?
- I come from a small company, what similar companies attendees DataEngBytes in Sydney last year?
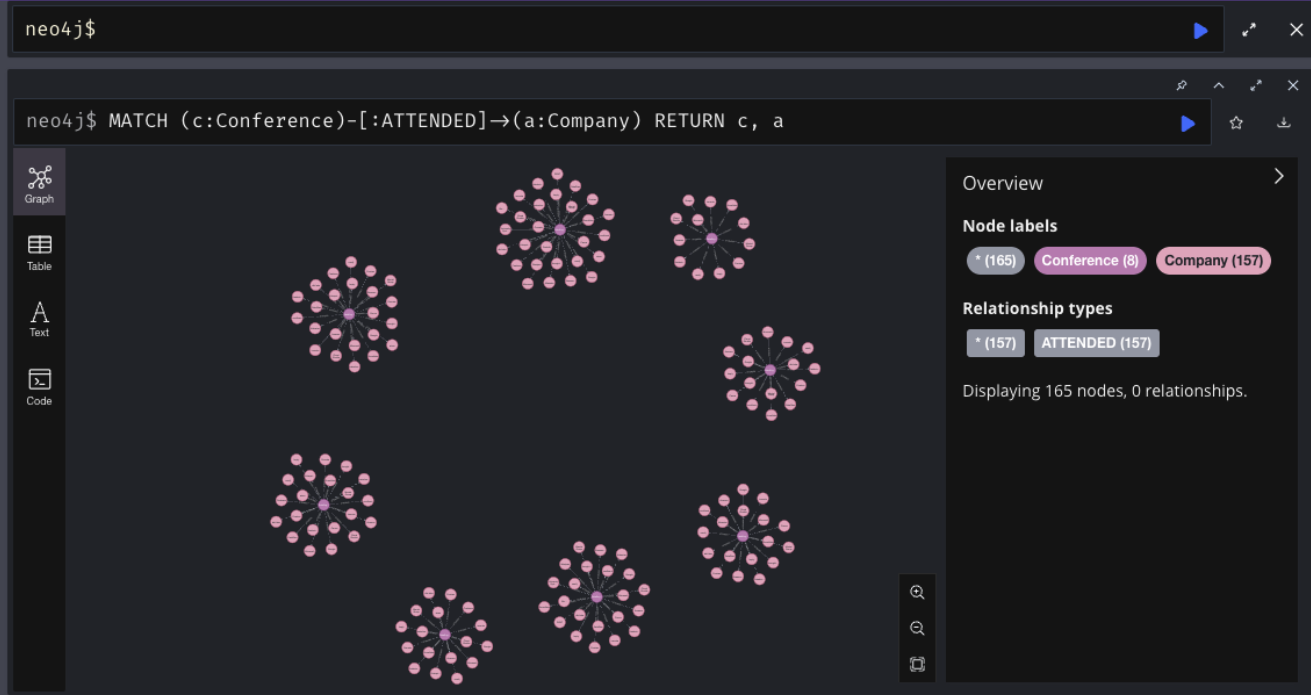
To enable RAG for our LLM, we spun up a Knowledge graph on Neo4j which did the following:
- Connected our conferences with venues and dates
- Connected previous conferences with attending companies
- Connected those companies with their classifications
- Connected the conference experience with prizes, catering and swag options available.
What’s happening under the hood?
1. User types in a plain English query to the chatbot, for example, “Where is the Sydney DataEngBytes conference being held in 2024?”
2. The question gets sent to the LangChain API.
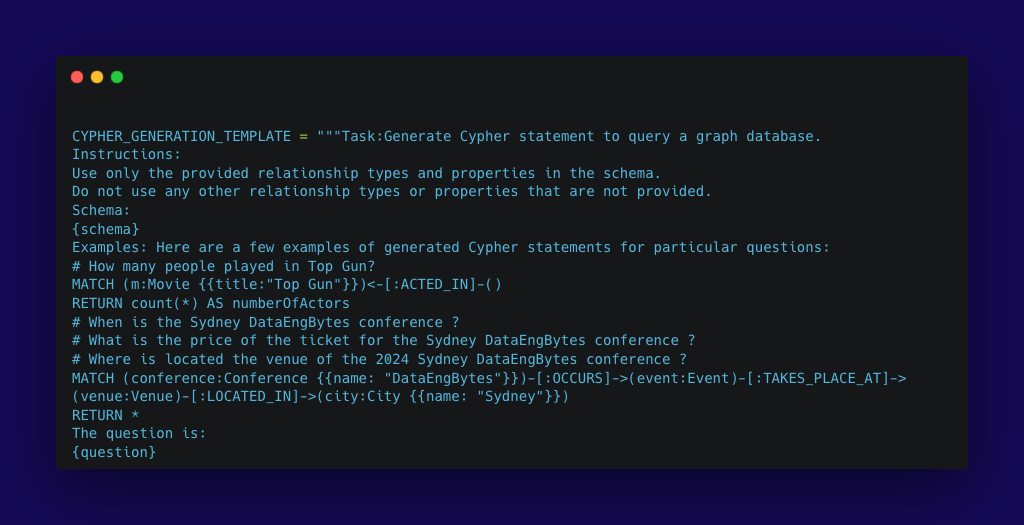
3. The query gets converted to cypher query (basically a ‘prompt engineer’s prompt’ – an instruction that tells the LLM the parameters needed in order to format an answer we’re expecting in return.) Langchain automates a cypher statement to query the graph database, an example as follows:
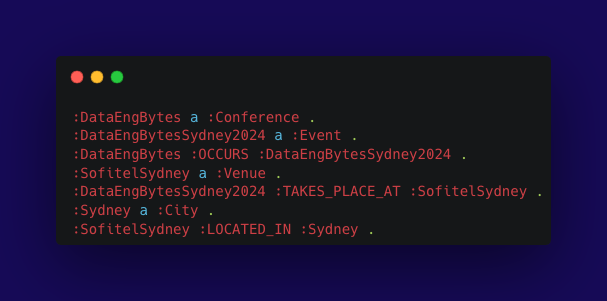
4. LangChain automates the cypher query against the Neo4J graph database, which has DataEngBytes data preloaded. The graph database houses triples - trios of related entities. This web of nodes and edges represents the relationships such as employment, venue the event takes place, city the event takes place in, attending companies, company sizes, and so on.
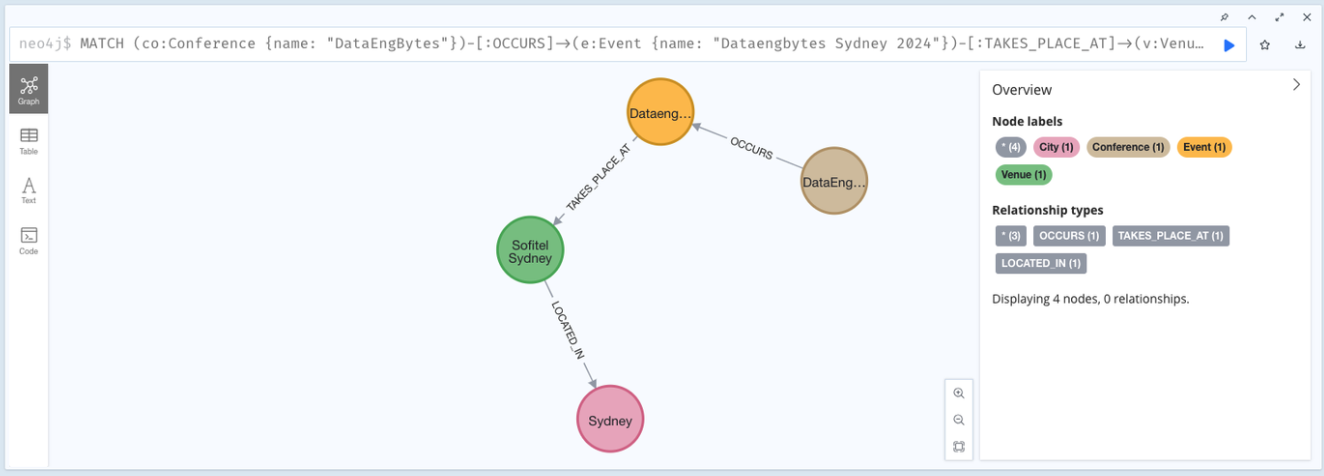
A visual representation of the relationships between nodes in our graph database, in this case mapping the relationship between DataEngBytes the conference (Conference), with DataEngBytes Sydney (the event), which takes place at Sofitel Sydney (the venue), located in Sydney (the city).
5. After the query is executed, the information is returned in raw data form (for example a list of venues, event dates, or names of companies similar in size to the one the user inputs into the chatbot).
6. The answer then gets shaped into a conversational English language response and served up to the user.
Conclusion
As my team and I learnt from integrating knowledge graphs and LLMS, expressing the data within your organisation in the right way can lead to seriously powerful outcomes for your customers. When you start thinking about your data in terms of relationships, your data model will naturally follow. I’m excited to see more developments in this space, and I hope you’ll agree that our proof of concept shows that knowledge graphs are the way to truly enable your organisation to capture the full power of its data.
Read our recap of the GraphSummit Sydney (powered by Neo4j) that took place at Beta Events on Thursday, 9 May 2024. If you're interested in exploring graph solutions for your business, get in touch with us today!
RELATED_NODES
NODE_CHAIN // SIG_FAST
NODE_01
Static egress IPs for Postgres on Fly.io: an Envoy egress proxy
Jun 8, 2026 · 06m read
NODE_02
AI Observability in Action: Cost Measurement & Evals with Bifrost, Langfuse, and Drover
Jun 5, 2026 · 06m read
NODE_03
Self-Governing Codebases: Bridging the Code-Architecture Gap with Governed RLMs
Jun 4, 2026 · 06m read
Cloud Shuttle Insights